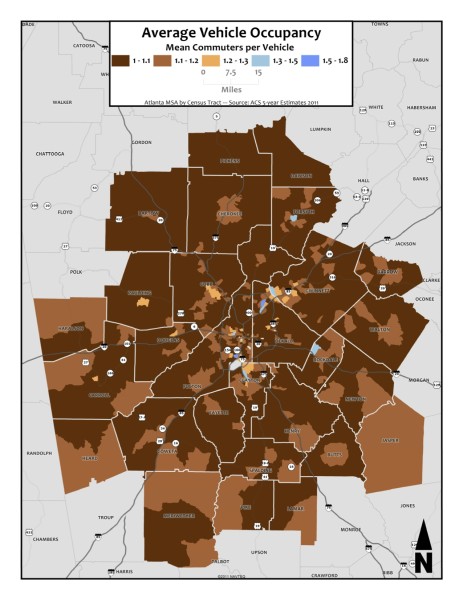
American Community Survey 5-Year Estimates 2007-2011
Average vehicle occupancy (number of occupants per vehicle)
American Community Survey 5-Year Estimates 2007-2011
Average vehicle occupancy (number of occupants per vehicle)
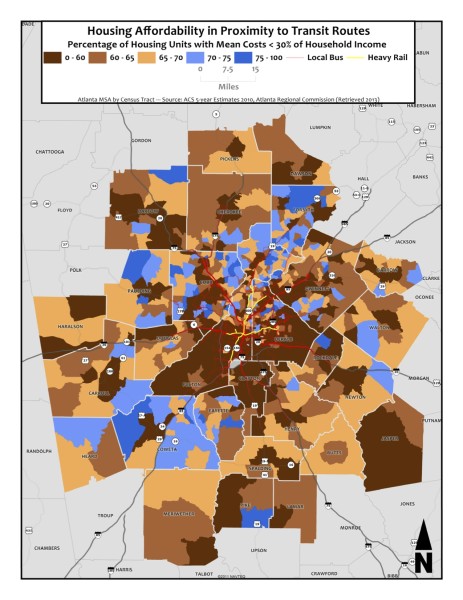
American Community Survey 5-Year Estimates 2006-2010
Atlanta Regional Commission (Retrieved 2013)
Percentage of housing units considered affordable (average unit costs equal less than 30% of household income) overlay with local & regional public transit guideways
Atlanta Regional Commission (Retrieved 2013)
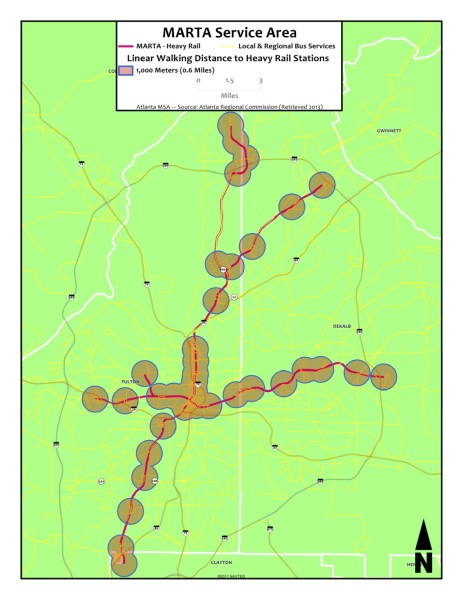
MARTA fixed guideway routes in red, and MARTA bus routes in yellow
Each station has a 1,000-meter walking-distance buffer showing the captive ridership areas that the train stations serve. Generally the industry standard walking distance is 0.5 mile for train stations and 0.25 mile for bus stops.
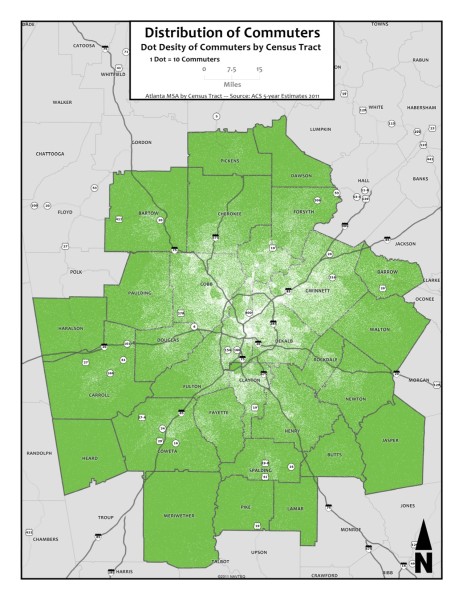
American Community Survey 5-Year Estimates 2007-2011
Spatial distribution of commuters calculated at the tract level overlaying counties whereas each individual white dot shown represents ten commuters
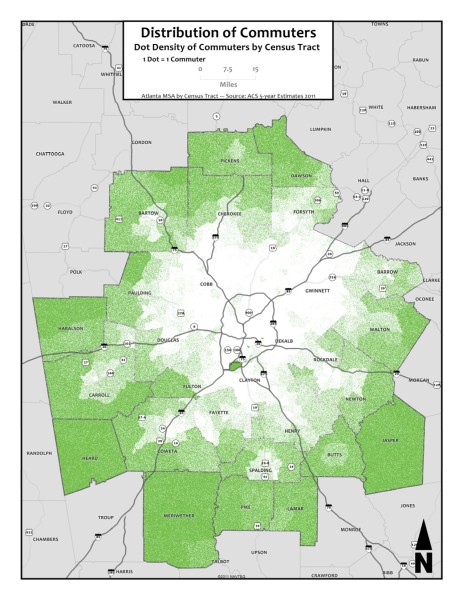
American Community Survey 5-Year Estimates 2007-2011
Spatial distribution of commuters calculated at the tract level overlaying counties whereas each individual white dot shown represents one commuter
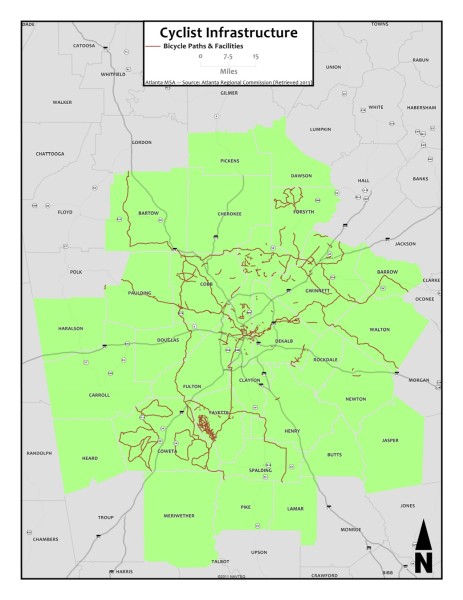
Atlanta Regional Commission (Retrieved 2013)
Bike lanes and bike-path guideways

American Community Survey 5-Year Estimates 2007-2011
Percentage of commuters traveling in multi-occupancy vehicles for home-to-work trips
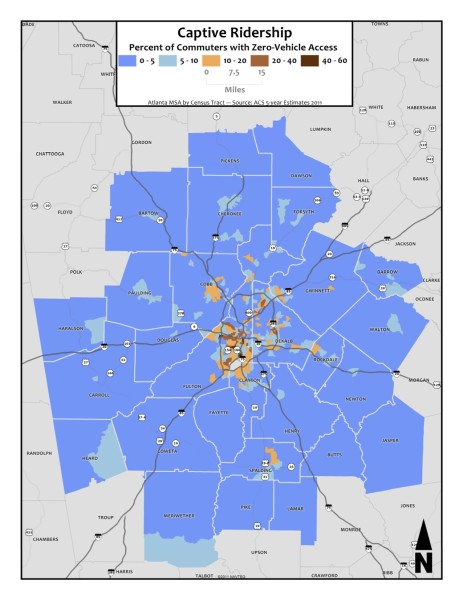
American Community Survey 5-Year Estimates 2007-2011
Percentage of commuters without access to a vehicle
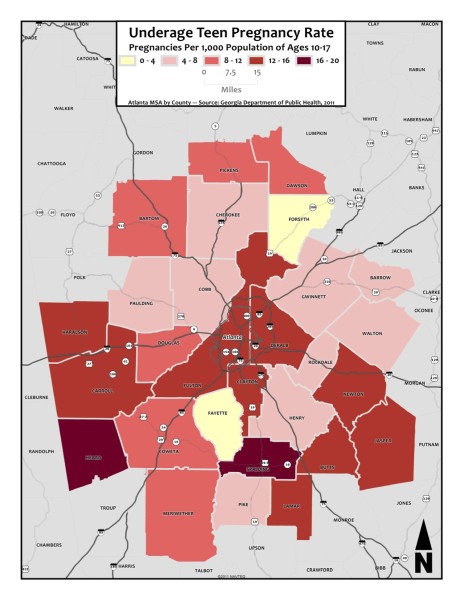
Georgia Department of Public Health, 2011
Underage Teen Pregnancies Ages 10-17 Rate per 1,000 Population
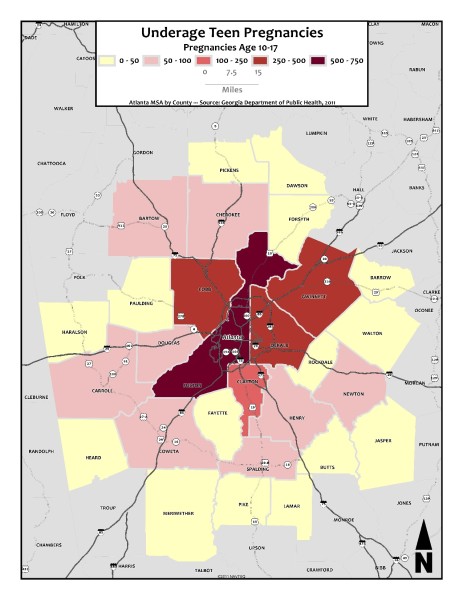
Georgia Department of Public Health, 2011
Numeric Count of Underage Teen Pregnancies Ages 10-17