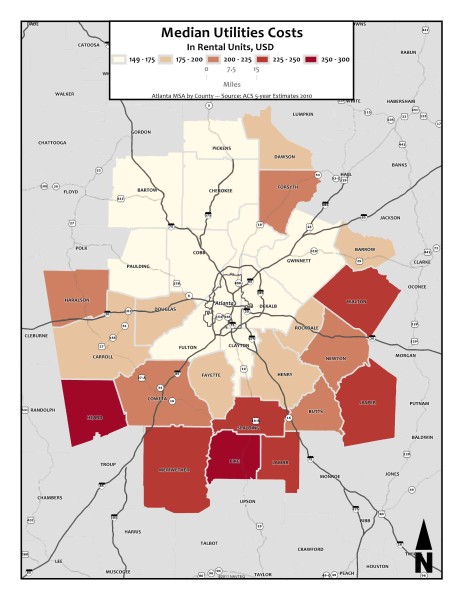
American Community Survey 5-Year Estimates 2006-2010
Median Cost of Monthly Utilities in Renter-Occupied Housing Units
American Community Survey 5-Year Estimates 2006-2010
Median Cost of Monthly Utilities in Renter-Occupied Housing Units
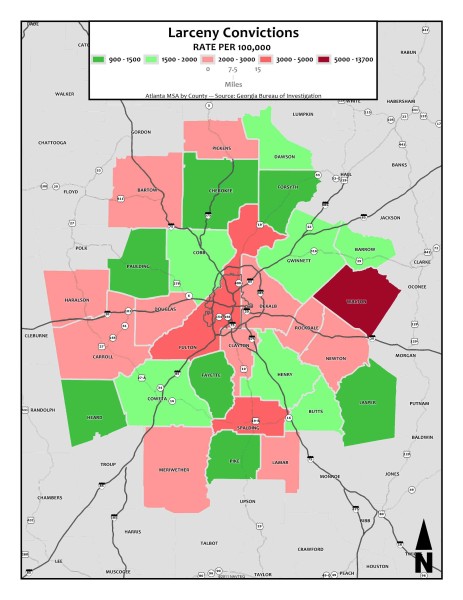
Source: Georgia Bureau of Investigation
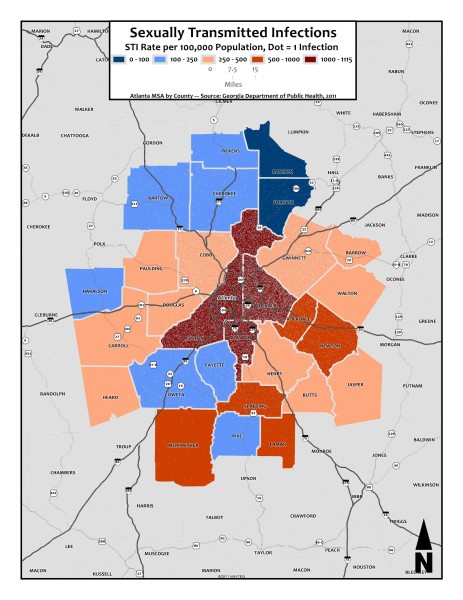
Georgia Department of Public Health, 2011
Reported sexually transmitted infections rate per 100,000 Population overlay with dot-density (Dot=1 reported infection)
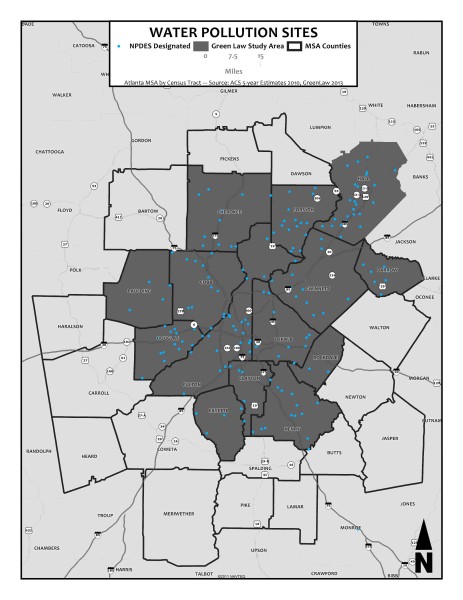
Source: GreenLaw 2013, ACS 5-Year Estimates 2010
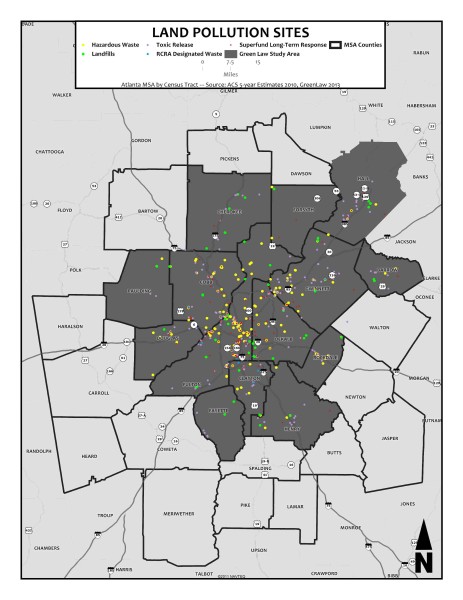
Source: GreenLaw 2013, ACS 5-Year Estimates 2010
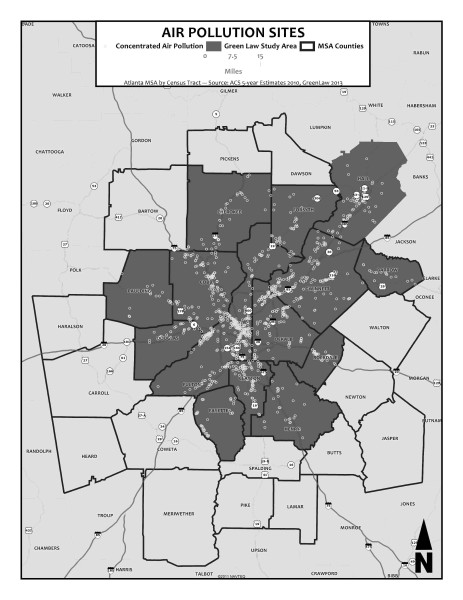
Source: GreenLaw 2013, ACS 5-Year Estimates 2010
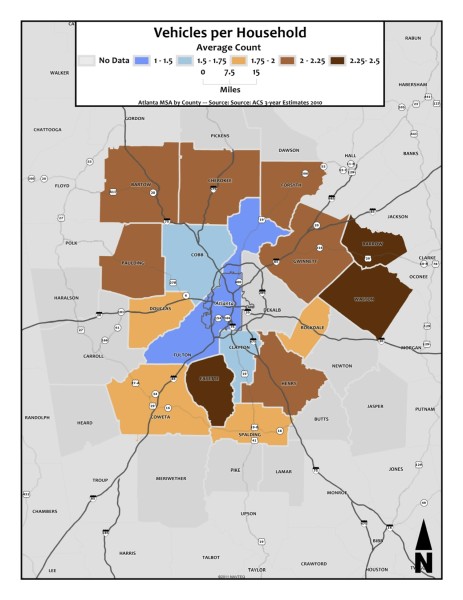
American Community Survey 5-Year Estimates 2006-2010
Average number of vehicles per household
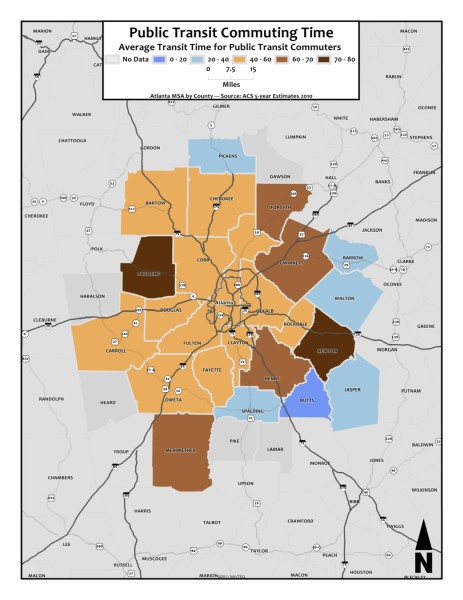
American Community Survey 5-Year Estimates 2006-2010
Average home-to-work trip time of public transit commuters in minutes
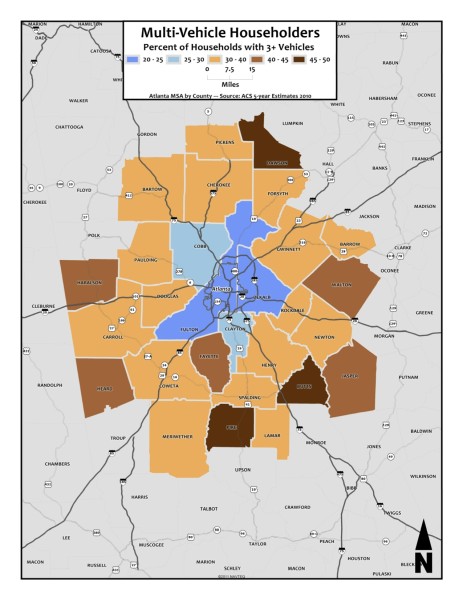
American Community Survey 5-Year Estimates 2006-2010
Percentage of commuters living in households with three or more vehicles
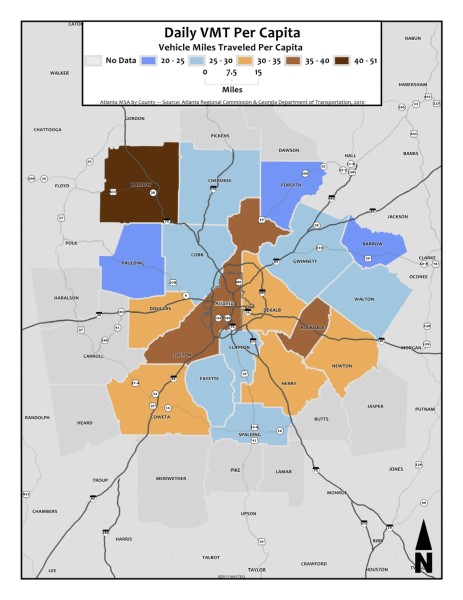
Atlanta Regional Commission, Georgia Department of Transportation; 2010
Average number of miles each vehicle travels in one day