American Community Survey 5-Year Estimates 2006-2010
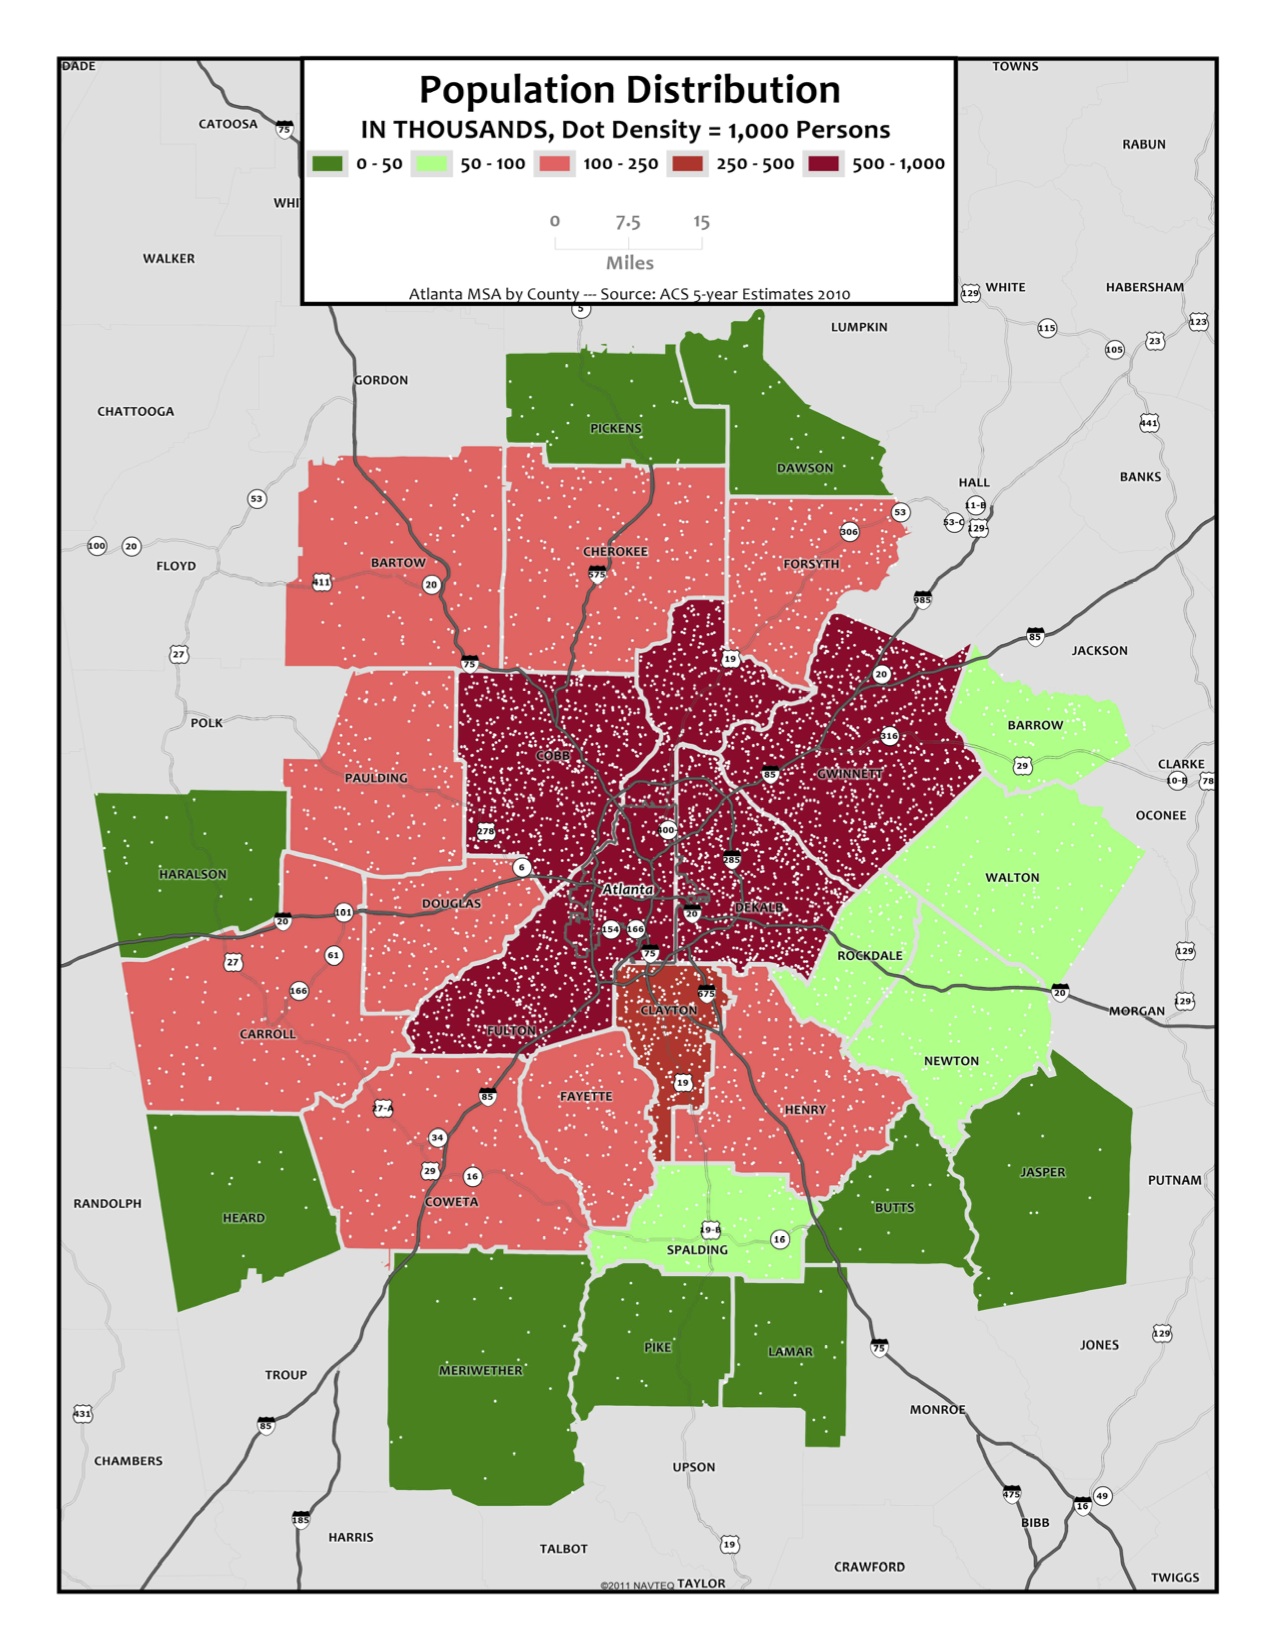
Green-Red Choropleth showing numeric count of population in data ranges from dark green (0-50,000) to dark red (500,000 – 1,000,000) – overlaid with a white dot-density where each dot represents 1,000 population.
This map allows you to see the density of people as it relates to the number of people who live in each county (counties grouped together in the same population range may vary in area size, so the dots counter-balance that by showing that density is also important to consider, not just raw jurisdictional numbers).
Download PDF of this Map